User Centered Design, Extracting the VoC through the Lens of Affinity Diagrams
Carlos M. Rodriguez Ph.D. | June 25, 2025
Read time: 5 minutes
What the KJ Method shows is that in order to truly exhibit creativity, one must go through a state of selflessness once, before insisting on the self.”
-Kawakita, Jiro 1996
VoC and Affinity Diagrams
User observation is paramount when designing personas, uncovering latent needs, and capturing the voice of the customer. When we conduct these observations in artificial environments, such as a laboratory setting, the researcher can manipulate variables and measure the outcome quantitatively. However, these environments do not provide the richness in discovering user behavior.
A more robust approach is through naturalistic observations that happen in the user’s natural environment. The uncontrolled nature of the setting potentially generates several biases; however, it provides an observation of behavior in context, offering unfiltered insights, and thus becomes a richer and more truthful description of the user. In completing usability testing or contextual inquiry through a grounded theory approach, the designer is required to understand behaviors, identify pain points, hidden patterns, and emotional reactions. A critical tool in the designer’s arsenal is affinity diagrams. Affinity diagrams enable the description of users’ actual behaviors, challenges, and needs, thereby transforming research into design solutions.
An Affinity Diagram
The affinity diagramming methods, also known as the KJ method, were conceptualized by Jiro Kawakita, a Japanese ethnographer. The technique has been applied in diverse projects, including persona development, user research, consumer analysis, product management, problem-solving, root cause analysis, quality improvement, and collaboration projects. The method is beneficial when confronting numerous facts that appear disorganized, analyzing large amounts of verbal data, simplification, and pattern recognition, as well as identifying possible relationships among themes emerging from an idea network. Finally, the method informs product design decisions, helping to include new features, areas of improvement, and differentiation options.
Affinity Diagramming Process
Affinity diagramming starts with writing affinity notes during the data identification stage. It is expected to collect several hundred affinity notes (200 to 300). The process includes the following steps.
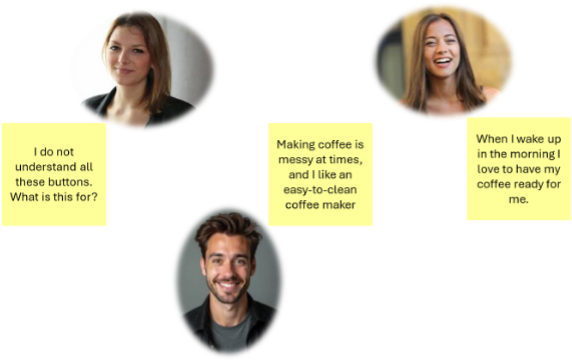
- Record each idea in a sticky note, card, or digital note. The notes reflect the “voice of the customer.” Generally, these notes are written in yellow affinity notes and in the first person (e.g., I…).
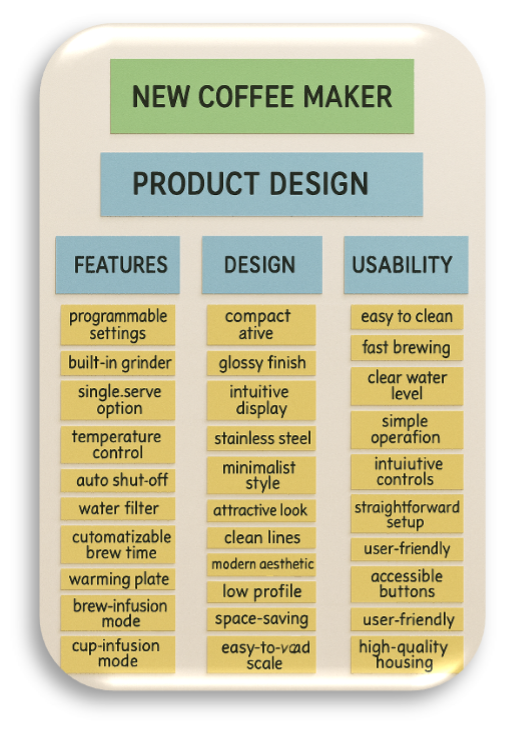
- These affinity notes are initially organized in groups and follow a hierarchical logic. These groups refer to user statements related to a specific topic or idea. Each group of yellow affinity notes will be identified with a blue affinity note on top. Please note that the text in the blue affinity note ideally is still a voice of the customer and you are not misleading the interpretation. If not, you can label it being sure not to summarize but identify a statement that “arcs” the content in the yellow sticky notes. Next, the blue sticky notes will be grouped and labeled with a pink sticky note (the final level is the green sticky note).
- Next, the groups are labeled to provide conceptual unity and understanding.
- The process is repeated, reaching two or more levels of analysis. The number of levels will depend on the complexity of the data and the questions being asked about it.
- It is advisable to label each level with a concrete and objective statement. Only the highest group level is completed using a green affinity note to illustrate the most abstract description.
- Discuss and clarify the clusters with the team members. Evaluate if there are controversial pieces of information that need to be moved to other clusters. Once the team agrees, be sure to label correctly the blue and green sticky notes texts.
Common Pitfalls in the Process

The practice of affinity diagramming has identified the following downsides (Nielsen Norman Group).
- Lack of clarity in the central project goal or inquiry question: When team members start to organize the affinity notes, they lack clarity in stating the focus question that drives the inquiry.
- Keyword matching: If team members group affinity notes by searching for matching words, this may mislead the overall assessment, as single words are left out of context and purpose. It is recommended to review the context, overall sense, and direction of the affinity note before grouping them.
- Groupthink: In some circumstances, a particular personality or perspective may be silently imposed when team members review the data. The consequence is a quick, unfounded, and weak conclusion about the content of the affinity notes. Groupthink can hinder the detailed and in-depth assessment of users' comments, potentially biasing theme identification.
- Reorganize as needed, do not overcategorize: Follow the comments of the team members and their impressions when analyzing the sticky notes; they may guide a reorganization, reclassification, or opening of a new category.
- Summarizing: It is particularly important not to summarize the voices at the lower levels. The researcher needs to maintain the level of detail as much as possible.
Affinity Diagramming Software
In-person group analysis of users’ information and affinity notes is conducted using color-coded stickers on a vertical or horizontal surface. I suggest a horizontal surface, such as solid or glass. Participants are more dynamic in this setting.
In doing affinity diagramming online, several software platforms are available to researchers. The most popular and flexible is Miro. Another option is FigJam by Figma, Lucidchart by Lucidspark, Canva, and Creately.
Conclusion
Affinity diagrams are a field and analytical research method that allows designers to capture the voices of the user in a legitimate and unfiltered way. User voices are collected through fieldwork and conversations with actual and potential users to understand their behavior, perceptions, insights, latent needs, and pain points related to their experience with a product or service. The insights are organized in a hierarchical manner, grouping initial user statements around inclusive themes. These themes will be utilized for product specification, product design, concept analysis, customer requirements (CRs and the Kano method), and persona design.
Further reading
About the Author
Carlos M. Rodriguez Ph.D.

Carlos M Rodriguez is an Associate Professor of Marketing and Quantitative Methods and Director of the Center for the Study of Innovation Management, CSIM in the College of Business, Delaware State University, USA. His publications have appeared in the Journal of Business Research, Journal of Business to Business Marketing, Journal of International Marketing, International Marketing Review, Management Decision, International Journal of Business and Social Sciences, Journal of Business and Leadership, and Journal of Higher Education Research & Development among others and several conference proceedings. Currently, he serves in the editorial board of several journals. His research interests are in the areas of entrepreneurship and strategic capabilities, luxury branding and experiences, product design and new product development teams, and relationship marketing. He recently published the book entitled Product Design and Innovation: Analytics for Decision Making centered in the design techniques and methodologies vital to the product design process. He is engaged in several international educational, research, and academic projects, as well, as, international professional activities.